As the first national polls following 2015’s historic election approaches, there seems to be very little buzz about the whole affair. In contrast to the days leading up to the National League for Democracy’s (NLD) landslide win two years ago, or even 2012’s by-elections that brought the first batch of NLD parliament members into office, there is a noticeable lack of enthusiasm for the upcoming polls on April 1.
Nineteen seats are up for grabs in this year’s by-elections. Three seats are available in the Upper House, nine in the Lower House, and seven at the state and regional level. The interactive map below uses data made available by the Union Election Commission and the Asia Foundation’s Mae Pay Soh project in order to explore details about the candidates who are contesting for each seat.
As the by-elections mark Burma’s fourth election in the span of a decade, the data that has been released about the candidates, parties and the results of each of those elections offer quite a significant amount of material to ponder. Sifting through information about the thousands of candidates and results for hundreds of districts could yield a plethora of insights, and the analysis offered in this piece merely scratches the surface.
Firstly, noteworthy is the perceived lack of interest and enthusiasm this time around, in comparison to previous years. It is, however, important to acknowledge what proportion of the population is directly affected by this year’s by-elections in comparison to those in 2012.
Tallying up the seats, this year’s 19 seats is less than half of the 48 that were contested five years ago. Add to that the fact that some seats this year are in remote parts of Shan State, where elections were cancelled in 2015 due to security risks. Therefore, the number of people affected by the elections this year is only about a quarter of those directly impacted by the last by-election. Around 11.4 million people lived in the districts where the elections were held in 2012, whereas only 2.6 million people live in this year’s districts.

What can be expected in terms of possible results, looking back at how the candidates for various parties performed in these districts in 2015?
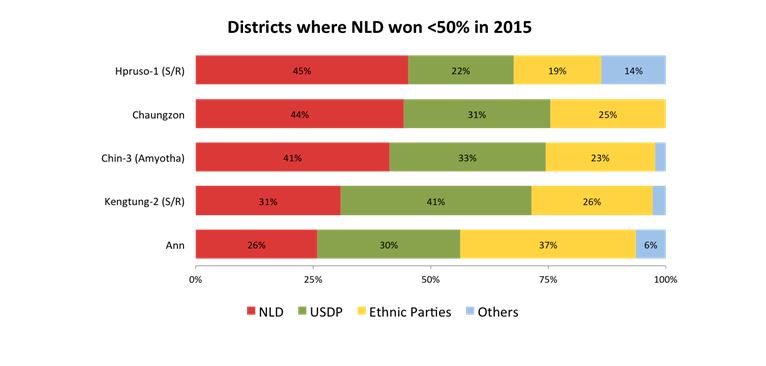
The NLD won the lion’s share of 11 of the seats being contested this year, but there was a noticeable trend in the margins with which they won.
The two charts below show the districts in which the NLD won more than 50 percent of the votes versus those in which they won less than 50 percent. Apart from Yawnghwe (Nyaungshwe) in Shan State, all of the other seats where the NLD swept the polls were in the Bamar majority heartland. In the Arakan, Chin, Shan, Karenni and Mon districts, even if they won, it was with much narrower margins. It is therefore likely that it will be in the ethnic states that they will face the staunchest competition this time around as well.


Gender parity remains distant when it comes to election candidates in Burma, but there seems to be a slight improvement this year when compared to 2015.
Overall, 18 percent of this year’s candidates are women, compared to 13 percent in 2012. In terms of individual parties, men outnumber women in all of them except for the Shan Nationalities Democratic Party, which is fielding five women and two men. Of the competing parties, the worst in this regard is the Union Solidarity and Development Party (USDP), which has assembled a line-up that is exclusively male.

Religious diversity seems to have taken a very slight hit, with all the candidates this year being only Buddhist or Christian, whereas in 2015, around two percent of candidates professed other religions besides these two. Among this minority, there were 27 Muslim candidates—the rest identified as animists or atheists.

Perhaps somewhat surprisingly, it turns out that the USDP candidates have a more diverse ethnic representation than the NLD does in this year’s by-elections, with their candidates roughly equally divided between Bamar, Shan and candidates of other ethnicity. Since almost half of the seats this time around are in Shan State—nine out of 19—it seems reasonable that Shan candidates be well represented.

The majority of candidates in previous elections, as well as this one, tend to be 50 years or older, but the current crop of candidates are slightly younger on average than those in 2015, as the two charts below point out.
The most populous age bracket in 2015 was that of 60-65 year olds, whereas this time around it is the 50-55 bracket that boasts the most candidates. The youngest candidate is 28-year-old Nang Nway Nway from the Shan Nationalities Democratic Party contesting for the Kesi-1 (Kyethi) seat in the Shan State parliament; the oldest is the NLD’s U Kyaw Khin, who is almost 78 years old, and is contesting for the Shan State parliament seat in Mong Hsu-1 (Mongshu).


I work as an advocate for open data and transparency, and being able to dig into these datasets that have been publicly released, and to communicate my findings to the public has been a dream come true. I would love to see even more data being released and more people analyzing and discussing the information.
But while the numbers can definitely tell interesting stories, they can never provide the complete picture. I found that out personally in 2015, after very enthusiastically voting for the first time in my life.
A few weeks after casting my ballot in Hlaing Tharyar Township for the NLD’s Dr. Than Myint—currently serving in the cabinet as Minister of Commerce—news surfaced that his PhD was from an unaccredited defunct institution called Pacific Western University. While a dataset in a spreadsheet can point one in the right direction of greater transparency, it still remains just the first step in a more comprehensive process. Nevertheless, it is one that I hope more people will take.


